
Reducing methane emissions remains one of the most important opportunities for the oil and natural gas industry to continue improving environmental performance while delivering the affordable, reliable energy Americans and U.S. allies depend on.
Satellite technology is creating new opportunities to identify emissions, verify performance, and accelerate methane reductions across the natural gas value chain. More information can be a powerful tool, but only alongside complete and accurate context.
A recent UCLA study examining methane emissions across major U.S. producing regions shows how quickly satellite observations can turn into sweeping conclusions. The report raises important questions about attribution and whether limited observations can support some of the headlines it generated.
Before researchers can rank operators, they first have to know who owns and operates the facilities they’re ranking. The UCLA report shows how often that step falls short.
Ranking Operators Is Easier Said Than Done
One of the UCLA report’s central goals is identifying what it calls “potentially responsible operators” for methane plumes observed across the Permian, Appalachian, and Haynesville basins.
The study itself acknowledges the challenge:
“Fewer than a third of the sources in the dataset could be matched with good confidence to potentially responsible owners using publicly available data—and because we rely on datasets that are incomplete and imperfect, even those matches are susceptible to inaccuracies.”
That is where the study runs into trouble. According to the report, researchers matched an operator with “good confidence” to fewer than a third of the emissions identified during the study period. For most sources the satellite flagged, UCLA could not say who was responsible.
Despite those limitations, the study ranks facilities and operators anyway, and the headlines that followed carried a certainty the underlying data does not support. When UCLA cannot name an operator for most sources, policymakers and the public should not treat its operator rankings as definitive: rather, UCLA matched plumes to operators automatically, and only where a single operator sat within 100 meters of the plume.
The Correction Behind the Ranking
The difficulties of assigning ownership aren’t hypothetical. One entry in UCLA’s Top 10 shows why attribution matters.
For example, UCLA’s Top 10 methane source table attributes a facility near Pecos, Texas to Western Midstream. The satellite collected every observation behind the ranking before Western Midstream completed its acquisition of the facility, which was owned by Brazos Delaware, on June 11, 2026. UCLA’s study window runs from January 1, 2025 to June 1, 2026, ending ten days before the deal did.
Attribution challenges also surfaced elsewhere. On September 18, UCLA revised its own table, changing the potentially responsible operator for the No. 2 site to ‘undetermined” after receiving what it called “industry information.” In the same update it added an operator to the No. 7 site “based on newly identified documents.”
Assets change hands, midstream ownership is layered, and public records can lag. But a ranking that assigns responsibility – and puts those details out to the public – has to get those details right.
A Few Observations Don’t Tell the Whole Story
Satellite technology has transformed how operators and regulators find methane emissions and gives real information into potential emissions events. But as UCLA itself acknowledges, those observations have limitations.
The report sets a low bar for a site to make the list:
“We define the Top 10 sites as those with the highest average methane emission rate observed from January 1, 2025, to June 1, 2026, by the Tanager-1 satellite, excluding sources with two or fewer detected plumes.”
The rankings are built from observations collected over roughly an 17 month period. Yet some facilities appear to have relatively few observations during that timeframe. In some cases, conclusions about facility performance are being drawn from only a handful of measurement days across an extended period.
Operational maintenance, scheduled blowdowns, weather conditions, and temporary equipment issues can all shape individual observations. A detected plume flags an event worth attention, but it does not necessarily capture how a facility performs day after day, month after month, or year after year. UCLA’s averages fold in the passes where the satellite saw nothing, but an average built on a few passes is still a small sample.
Context becomes even more important when a relatively small snapshot of activity becomes the basis for conclusions about companies or the industry’s overall environmental performance.
Reducing Emissions Requires More Than Rankings
The UCLA report argues there are further opportunities to reduce methane emissions throughout the natural gas supply chain.
Operators across the industry have spent years investing in advanced leak detection technologies, optical gas imaging, continuous monitoring systems, and infrastructure upgrades that find and cut emissions. As EID has previously explored, those efforts have helped drive down methane intensity even as American natural gas production continues to grow. EPA reporting data show total methane emissions from the top producing basins fell 44 percent between 2011 and 2023.
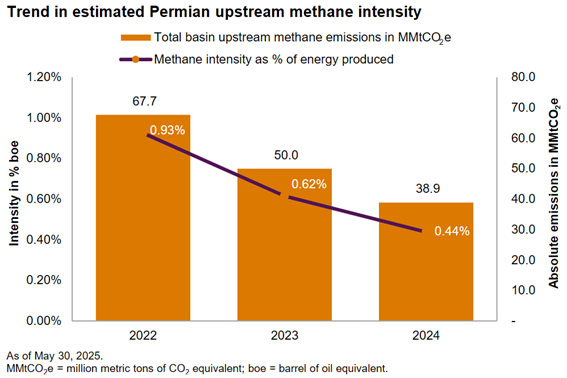
Source: S&P Global Commodity Insights
Notably, UCLA’s own analysis points to evidence of improvement at several facilities. The report notes that the No. 1, No. 2 and No. 7 sites showed no plume on their most recent satellite pass, which UCLA labels “evidence of possible mitigation.”
Yet, few headlines mentioned it. Monitoring exists so operators can find and fix emissions, and at the top of UCLA’s own list that appears to be happening. That requires researchers, regulators, and operators working from complete and accurate information.
Researchers should work with operators to verify ownership records, better understand operational data, and identify mitigation efforts before publishing rankings that drive headlines. UCLA says it welcomes operators to contact it with additional information. But that invitation belongs before publication, not after.
The Bigger Picture on U.S. LNG
The UCLA report focuses on the Permian, Appalachian, and Haynesville basins because, in its words, they are the three basins “that export the most LNG to Europe.”
Demand for U.S. LNG continues to grow because it provides affordable, reliable energy both at home and to allies. EIA projects North American LNG export capacity could more than double by 2029, with the United States supplying roughly 80 percent of that growth. According to a recent S&P Global analysis, LNG is on track to become America’s second largest net export industry by 2031 while maintaining some of the lowest natural gas prices in the world.
The study’s focus on methane emissions should not obscure the larger story. The same natural gas supply chain feeding LNG exports is also helping strengthen energy security for U.S. allies, reduce reliance on Russian gas, and create hundreds of thousands of American jobs.
Methane reductions and LNG growth are not competing goals. Operators have shown that environmental progress and energy security can move together.
Bottom Line
Satellite technology is an important tool for identifying methane emissions, but it is only one input, and a partial one. When a ranking cannot name an operator for most of its sources and is relying on incomplete or inaccurate information, it deserves scrutiny before it earns headlines. Reducing emissions starts with accurate data, and that means transparency, collaboration, and a commitment to getting the facts right.
The post Satellite Data, Missing Context: A Closer Look at UCLA’s Methane Claims appeared first on .
This post appeared first on Energy In Depth.


